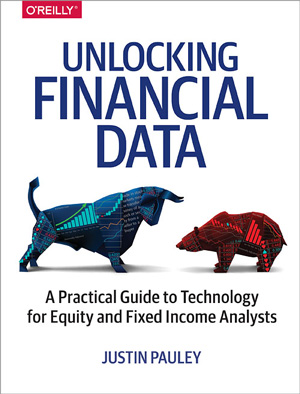
出版时间:2017.10
官网链接:O’Reilly
下载地址:百度网盘(PDF+EPUB+AZW3)
提取码 :qt37
内容简介:
Investors recognize that technology is a powerful tool for obtaining and interpreting financial data that could give them the one thing everyone on Wall Street wants: an edge. Yet, many don’t realize that you don’t need to be a programmer to access behind-the-scenes financial information from Bloomberg, IHS Markit, or other systems found at most banks and investment firms.
This practical guide teaches analysts a useful subset of Excel skills that will enable them to access and interpret financial information—without any prior programming experience. This book will show analysts, step-by-step, how to quickly produce professional reports that combine their views with Bloomberg or Markit data including historical financials, comparative analysis, and relative value. For portfolio managers, this book demonstrates how to create professional summary reports that contain a high-level view of a portfolio’s performance, growth, risk-adjusted return, and composition. If you are a programmer, this book also contains a parallel path that covers the same topics using C#.
Topics include:
- Access additional data that isn’t visible on Bloomberg screens
- Create tables containing corporate data that makes it possible to compare multiple companies, bonds, or loans side-by- side
- Build one-page analytic (“Tear Sheet”) reports for individual companies that incorporates important financials, custom notes, relative value comparison of the company to its peers, and price trends with research analyst targets
- Build two-page portfolio summary report that contains a high-level view of the portfolio’s performance, growth, risk-adjusted return, and composition
- Explore daily prices and facility information for most of the tradable corporate bond and loan market
- Determine the relationship between two securities (or index) using correlation and regression
- Compare each security’s performance to a cohort made of up of securities with similar risk and return characteristics
- Measure portfolio risk-adjusted return by calculating variance, standard deviation, and Sharpe ratio
- Use Markit data to identify meaningful trends in prices, new issue spreads, and refinancings